Recognized by Clutch.co as a top-rated Mobile App Development Company.
folio3-mobile
US 408 365 4638
START YOUR PROJECT
  • Solutions
    • Apps Discovery Services
    • Team Augmentation
    • Enterprise
    • AR/VR
    • IoT
    • Wearables
    • Field Sales
    • On Demand Apps
  • Industries
    • Retail
    • Agriculture
    • Healthcare
    • Pharmaceutical & Life Sciences
    • Manufacturing
    • Automotive
    • Logistics
    • Education
  • Technologies
    • Native Mobile Apps
      • iOS
      • Android
    • Cross Platform Apps
      • React Native
      • Flutter
      • Ionic
      • Xamarin
      • NativeScript
      • Sencha
  • Portfolio
  • Blog
  • Contact Us

How to measure React app performance

Published by: Noc Folio3 | February 1, 2021
SCROLL AND BE AMAZED!
Home > React Native > How to measure React app performance

Performance is the key aspect of high-quality software. While developing any software, one must know how to make it performant enough. In this blog, we will see how we can measure the React app performance through React Profiler. 

In React app development, we are mostly playing around on components. Components let you split the UI into independent, reusable pieces. You create a component and React renders it to DOM. 

BUT …. 

But the main problem here is to ensure that these components should not render unnecessarily, and the cost of rendering should be optimized enough. 

React Profiler 

The React profiler measures how often a component is rendered and what’s the cost of rendering. Its purpose is to help identify parts of an application that are slow so that we can work on optimizing them. 

Note: 

Profiling adds some additional overhead, so it is disabled in the production build. 

To opt into production profiling, React provides a special production build with profiling enabled. Read more about how to use this build at fb.me/react-profiling. 

Usage 

To profile the application, open React Dev tools, start recording an activity, render any components and stop the recording. 

Example  

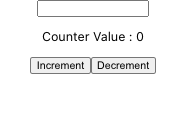
As an example, on how to find performance measures of a component, I have created a basic App component, which has an input field and a Counter component. 

As I type in the input field the App component changes its state and re-rendered itself with the updated input value. Now let Profile this in React Dev tool and see how our components got ranked based on the rendering time. 

As you can see in the dev tool ranked view, it highlights the Counter component in yellow, this means we have some problem in this component, and we can optimize it. 

If you notice in the right side window, the Counter component re-render itself three times on every keystroke and takes a total time of 1.2ms on render. Although this component has nothing to do with the input value on the App component. 

In order to avoid this re-render, you can memorize your Counter component. I am not going to show you how to do that as it is not part of our topic right now. What I want to demonstrate here is how efficiently we can measure our app performance and bottlenecks through React Profiler. 

The Profiler is indeed useful but a bit cumbersome to perform an activity and record. There is another way to profile a component programmatically. That’s through React Profiler API.  

Using Profiler API is simple, you can do that in two steps. 

First, import Profiler from React in your file. 

import {Profiler} from “react” 

Secondly, wrap your component inside <Profiler />,  

The Profiler takes two properties. An id to uniquely identify the commit and onRender callback that describe what was rendered and the length of time it took, includes following 

  • phase: “mount” (if tree mounted) or “update” (if re-rendered)
  • actualDuration: time rendering the committed update
  • baseDuration: estimated time to render full subtree without memoization
  • startTime: Time when Reach began rendering the update
  • commitTime: Time when React committed the update
  • interactions: interactions belonging to the update

Now reload the application and head over to the console. You will see the following timings.

As I type in the input field, on every keystroke the Counter component gets re-rendered taking an extra amount of time, so here you have to see what causes this re-render and how you can optimize it.

Conclusion:

React Profiler is a great tool to measure the performance cost of your application. It helps you identify the performance bottleneck in your application so that you can identify those and fix them during development.


About Noc Folio3

Newsletter

Search

Archives

  • December 2023
  • April 2023
  • March 2023
  • October 2022
  • September 2022
  • August 2022
  • July 2022
  • June 2022
  • April 2022
  • March 2022
  • February 2022
  • October 2021
  • September 2021
  • May 2021
  • February 2021
  • January 2021
  • December 2020
  • November 2020
  • October 2020
  • May 2020
  • April 2020
  • March 2020
  • February 2020
  • January 2020
  • December 2019
  • November 2019
  • October 2019
  • September 2019
  • August 2019
  • July 2019
  • May 2019

Recent Posts

  • Exploring Flutter Navigation: From Basics to Advanced Routes
  • Web UI Test Automation with Pytest-BDD
  • How to fix IOS compass calibration issues
  • Testing Android Applications With Perfect Coverage
  • How to use useRef hook efficiently? – React

Tags

  • android
  • angular-state-management
  • Automation
  • Compass
  • cross-platform
  • css
  • development
  • firebase
  • hooks
  • ios
  • learn-ngrx
  • ngrx-beginner
  • ngrx/store
  • QA
  • react-native
  • reactjs
  • scss
  • stylesheet
  • styling
  • Testing
  • Test Script
  • UI-UX

Newsletter

Newsletter

Post navigation

Previous What are the Top 5 Trending App Ideas For Startup Companies To Invest In 2021
Next WHAT IS A STARTUP ACCELERATOR AND HOW DOES IT WORK FOR A STARTUP APP DEVELOPMENT COMPANY?
Schedule an Appointment with our Mobile App Development Expert
Footer Menu
  • Company
    • About Us
    • Portfolio
    • Blog
    • Careers
    • Contact Us
  • Solutions
    • Apps Discovery Services
    • Team Augmentation
    • Enterprise App Development
    • AR/VR Application Development
    • IoT Application Development
    • Wearables Apps Development
    • Field Sales
    • On-Demand Apps Development
  • Technologies
    • iOS
    • Android
    • React Native
    • Flutter
    • Ionic
    • Xamarin
    • NativeScript
    • HTML5
    • Sencha
  • Industries
    • Retail
    • Agriculture
    • Healthcare
    • Pharmaceutical
    • Manufacturing
    • Automotive
    • Logistics
    • Education

US Office

Belmont, California – 1301 Shoreway Road, Suite 160, Belmont, CA 94002

Pleasanton, California – 6701 Koll Center Parkway, #250 Pleasanton, CA 94566

Tel: +1 408 365 4638
Support: +1 (408) 512 1812

Mexico Office

Amado Nervo #2200, Edificio Esfera 1 piso 4, Col. Jardines del Sol, CP. 45050, Zapopan, Jalisco, Mexico

Bulgaria Office

49 Bacho Kiro Street, Sofia, 1000, Bulgaria

Canada Office​

895 Don Mills Road, Two Morneau Shepell Centre, Suite 900, Toronto, Ontario, M3C 1W3, Canada

UK Office

Export House, Cawsey Way, Woking Surrey, GU21 6QX

Tel: +44 (0) 14 8361 6611

UAE Office

Dubai, UAE – Dubai Internet City, 1st Floor, Building Number 12, Premises ED 29, Dubai, UAE

Tel: +971-55-6540154
Tel: +971-04-2505173

Pakistan Office

Folio3 Tower, Plot 26, Block B, SMCH Society, Main Shahrah-e-Faisal, Karachi.

First Floor, Blue Mall 8-R, MM Alam Road Gulberg III, Lahore.

Tel: +92-21-3432 3721-4 

© 2025, Folio3 Software Inc., All rights reserved.

  • Privacy policy and terms of use
  • Cookie Policy
Follow us on
Facebook-f Linkedin-in Instagram

Get a free app audit

[contact-form-7 id="3548" title="Float Banner Form"]