

Website Performance and speed are considered major elements that drive user experiences and pave way for business growth, especially in the ecommerce industry. Ecommerce development companies pay great emphasis on web performance and they regularly conduct website performance tests to find out hidden bugs that may be affecting any website functionality.
Millions of users visit these ecommerce websites at the same time. The web traffic is particularly high during the discount/holiday seasons when hundreds, if not thousands of users, visit these websites to buy stuff online. During the peak season, there’s a lot of cut-throat competition between these ecommerce websites. If a user visits an ecommerce website and experiences that a particular page is taking a lot of time to load, he won’t wait 10 seconds, instead he will just go to the other website that is offering similar products. If a website is not optimized, and hundreds of users start visiting it, then the response time of that website will sure drop resulting in dissatisfied visitors.
Therefore, it is imperative for every website owner to conduct a web performance test at least once every quarter to keep the website-health in check. Below are the best tips for testing the performance of website:
The very basic thing is to observe the resources that are taking more than desired time to load. There are various performance testing tools for this particular task, but the tool I like to use is a Google Chrome extension called “Analyze Page Performance”.
Now let’s see how this web performance too works. As you can see in below screenshot it is showing the response time of the login page of website i.e. 23.3s

Let’s have a look at the resources that are taking a lot of time to load. In order to do so, just click on the extension and then click “details” tab.

As you can see there are three tabs including JS resources, CSS resources and Image resources and by visiting all three tabs you can easily monitor the resource that is taking more than required time to load. Moreover, you can see there are many JS requests sent in loading this page so ask your developer if bundling is possible so that minimum requests may hit the server. Similarly, you have to take a look into the CSS and Image resources as well in order to monitor which of these are taking too much time to load and ask your developer to optimize them as much as they can.
Visit product and category pages and have a look at image sizes and make sure they are optimized. The ideal images size should not be more than 50KB and no image should be in MBs. Sometimes customer provides high quality images to use in category pages such as Banners, so before using those images as banners they should be optimized or minified.
Minification of CSS and JS plays a vital role in the performance of a website. Minification is the process of minimizing code and markup in your web pages and script files. It’s one of the main methods used to reduce load times and bandwidth usage on website. For figuring this ou there are lots of website testing tools available for free, but the tool that’s my favorite is “GTmetrix”. Open the tool’s website and just enter your webpage URL and click analyze. Below is the picture of how can you analyze the CSS and JS that need to be minified.
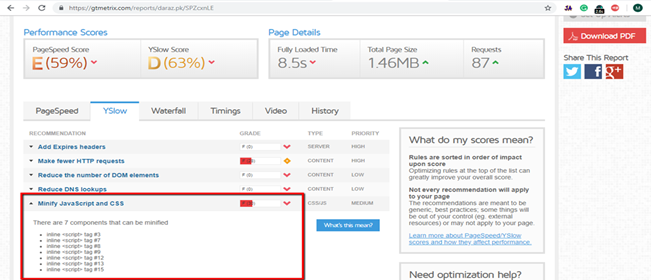
After getting results, open YSlow tab and here you can see the status of minification of CSS and JS. Grade F means the website is not optimized at all and minification is really needed on the respective webpage/site. It also tells details in which it shows where minification can be done
In web performance tip#3 image you can see some more recommendations such as “Make fewer http requests”. Tt means that the page has more than enough JS calls. Ask your developer to combine them in order to make fewer requests; this is called Bundling. But bundling is quite a tricky thing and it is imperative that you monitor your web closely before and after bundling. For example, before bundling you have noticed that number of JS requests on the current page is 150+ and load time of page is 8s, and after bundling the total number of requests reduced to 20 but page load time increases to 10s. This happens because the bundle size is greater than the total file size of all non-bundled JS files as bundling loads all the JS files present on the entire website. But, through ‘Require JS optimizer’ you only load required JS files on a specific page which is Magento web developer’s weapon of choice. For checking the number of JS requests and page load time for each page press “F12” and open “Network” tab

Check if “Caching” is enabled or not. Not using caching mechanism also increases the page load time because on every visit browser is retrieving the data by querying the web server again and again in absence of web caching technique. Web caching stores the shared page elements close to the user after first visit and retrieves this data from stored location on second visit rather than querying the web server again so that page can load faster than before. The question is how to test if caching is on or not?
1) For this just open the console pressing “F12”.
2) Go to Network tab, now hit the desired URL you want to test.
3) In console you will see the size column in which it shows the size of each shared page element. If you visit the same page again and see that all important shared page elements are coming from cache, then it means that caching mechanism is on. For elaboration, just look at below images,
First Visit:

Second Visit:

Test if CDN is configured on the website or not, but before that just keep in mind that configuring CDN is not necessary; it’s the next level in web optimization and is also not free. It should only be used when all other caching techniques are not helping in increasing a website’s performance.
Basically, CDN, Content Delivery Network, caches the static content of site such as (CSS, JS and Images) and stored this information in the network of geographically dispersed servers closed to users.
Just inspect the page source of the webpage and you will see that the term ‘cdn’ is present in the URL of assets like images. This means that the CDN is configured.

Test the “TTFB” of the web page. What is TTFB(time to first byte)? Let’s take an example of our BLOG; If someone requests to read our blog from search engine, his web browser requests information from server. TTFB is the number of ms it takes for a browser to get the response from web server; Didn’t get this? Don’t worry just open your browser enter any URL and just look at the movement of loader on the tab.

As, you can see it is not getting any response i.e it is still displaying “Google.com” instead of “daraz.pk”. The loader is moving anti-clockwise means it had sent requests to the server and is waiting for the response. But suddenly, it starts rotating clockwise and daraz.pk opens

Rotation of clockwise from Anti-clockwise means sever have responded on the request and have sent relevant information and now your browser is displaying the relevant info.
So in other words, the time taken by loader to change its rotation to clockwise from anti-clockwise is referred as TTFB. Again there are multiple performance testing tools that can be used to check TTFB. My personal favourite is ‘Webpagetest.org’.
Ideal TTFB for Static content should be 200ms and for Dynamic content it should be 200-500ms
So this brings us to the end of our article. Though these are some basic tips to conduct a website performance test, following them will help optimize your website and provide a better experience to your user. Happy Testing!
If you have any query related to ecommece website development, be sure to get in touch by filling up this form.
USA408 365 4638
1301 Shoreway Road, Suite 160,
Belmont, CA 94002
Whether you are a large enterprise looking to augment your teams with experts resources or an SME looking to scale your business or a startup looking to build something.
We are your digital growth partner.
Tel:
+1 408 365 4638
Support:
+1 (408) 512 1812


COMMENTS (0)
Tweet